# Create the data for the chart
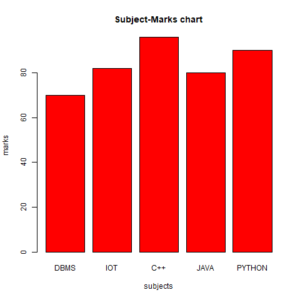
marks <- c(70,82,96,80,90)
subject <- c("DBMS","IOT","C++","JAVA","PYTHON")


png(file = "subject_marks.png")

# Plot the bar chart
barplot(marks,names.arg=subject,xlab="subjects",ylab="marks",col="red",
main="Subject-Marks chart",border="black")

# Save the file
dev.off()


#output
# Create the data for the chart marks <- c(70,82,96,80,90) subject <- c("DBMS","IOT","C++","JAVA","PYTHON") png(file = "subject_marks.png") # Plot the bar chart barplot(marks,names.arg=subject,xlab="subjects",ylab="marks",col="red", main="Subject-Marks chart",border="black") # Save the file dev.off() #output