Sign Up

Have an account? Sign In Now

Sign In

Forgot Password?

Don't have account, Sign Up Here

Forgot Password

Lost your password? Please enter your email address. You will receive a link and will create a new password via email.

Have an account? Sign In Now

You must login to ask a question.

Forgot Password?

Need An Account, Sign Up Here
Sign InSign Up

SIKSHAPATH

SIKSHAPATH Logo SIKSHAPATH Logo

SIKSHAPATH Navigation

  • Home
  • Questions
  • Blog
    • Computer Science(CSE)
    • NPTEL
    • Startup
  • Shop
    • Internshala Answers
Search
Ask A Question

Mobile menu

Close
Ask a Question
  • Home
  • Questions
  • Blog
    • Computer Science(CSE)
    • NPTEL
    • Startup
  • Shop
    • Internshala Answers
Home/Questions/Q 10708
Next
In Process
Berlin
  • 0
Berlin
Asked: January 14, 20222022-01-14T23:46:58+05:30 2022-01-14T23:46:58+05:30In: Data Science

Write the function used to plot the barcharts. Bargraph should have (title of graph, name of x axis, name of …

  • 0

Write the function used to plot the barcharts. Bargraph should have (title of graph, name of x axis, name of y axis, colour is red). Write the code and paste the screenshot of output.

r language
  • 1 1 Answer
  • 134 Views
  • 0 Followers
  • 0
Answer
Share
  • Facebook

    1 Answer

    • Voted
    • Oldest
    • Recent
    1. I'M ADMIN
      2022-01-15T00:33:16+05:30Added an answer on January 15, 2022 at 12:33 am
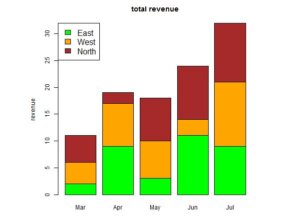
      Syntax:
      
      barplot(H,xlab,ylab,main, names.arg,col)
      
      Example:
      
      # Create the input vectors.
      colors = c("green","orange","brown")
      months <- c("Mar","Apr","May","Jun","Jul")
      regions <- c("East","West","North")
      
      # Create the matrix of the values.
      Values <- matrix(c(2,9,3,11,9,4,8,7,3,12,5,2,8,10,11), nrow = 3, ncol = 5, byrow = TRUE)
      
      # Give the chart file a name
      png(file = "barchartnew.png")
      
      # Create the bar chart
      barplot(Values, main = "total revenue", names.arg = months, xlab = "month", ylab = "revenue", col = colors)
      
      # Add the legend to the chart
      legend("topleft", regions, cex = 1.3, fill = colors)
      
      # Save the file
      dev.off()
      
      
      #goto your current directory(document) open file barchartnew.png
      #you will get image same as
      
      • 0
      • Reply
      • Share
        Share
        • Share on WhatsApp
        • Share on Facebook
        • Share on Twitter
        • Share on LinkedIn

    Leave an answer
    Cancel reply

    You must login to add an answer.

    Forgot Password?

    Need An Account, Sign Up Here

    Sidebar

    Stats

    • Questions 1k
    • Answers 1k
    • Posts 139
    • Best Answers 65
    • NPTEL Programming in Java Week 2 Assignment Answers 2023
    • (Solution Revealed) NPTEL Ethical Hacking Week 2 Assignment 2023
    • Probability and Statistics NPTEL Assignment answers – Week 1
    • NPTEL Joy of Computing Using Python Week 2 Assignment Answers 2023
    • NPTEL Problem Solving Through Programming In C Assignment 2 Answers 2023

    Popular Questions

    • I'M ADMIN

      Internshala ethical hacking final test answers: Question sequence differs but ...

      • 6 Answers
    • AK

      You have a green lottery ticket, with ints a, b, ...

      • 4 Answers
    • mj

      Solve by Gauss Elimination Method 5x+y+z+w=4 ,x+7y+z+w=12 , x+y+6z+w=-5, x+y+z+4w=-6

      • 3 Answers

    Explore

    • Recent Questions
    • Questions For You
    • Answers With Time
    • Most Visited
    • New Questions
    • Recent Questions With Time

    Footer

    Helpful Links

    • Contact
    • Disclaimer
    • Privacy Policy Notice
    • TERMS OF USE
    • FAQs
    • Refund/Cancellation Policy
    • Delivery Policy for Sikshapath

    Follow

    © 2021-2022 Sikshapath. All Rights Reserved

    Insert/edit link

    Enter the destination URL

    Or link to existing content

      No search term specified. Showing recent items. Search or use up and down arrow keys to select an item.